
I love that you can always find multiple ways to solve one problem. Inspired by the Youtube video by Guys in the cube and blog reading from SQLBI.com, I found there are two ways to dynamically change measures in the same visual. The first way is more towards front end report developer using bookmark and the second way is more towards data modeler using a technique called disconnected tables.
Bookmarks method:
The basic steps are:
- Enable Bookmarks under File ->’Options and Settings’ ->Options->Preview Features->’Bookmarks’
- Create one visual for example a bar chart with first measure, for example Revenue by Sales Territory
- and copy paste the visual 2 times. in the coped visuals replace the measure you want to replace. For example cost by sales territory.
- Overlay the three visuals together.
- Go to ‘View’ on the top tool panel and make sure ‘Bookmarks Pane’ and and ‘Selection Pane’ are checked
- Add bookmarks with selection of visuals to be visible associated with the bookmark you created
- .

- Add the images/shapes which represent the measure you want to select on and link it to the bookmark you created.

Disconnected Table method:
This method is more towards PowerBI modelers. Basically, the idea is to have a Field in a independent table (no relationship to other tables) as Slicer with your measure choice and then create a measure using SELECTEDVALUE function to have the measure dynamically switch referring measures based on the choice made on the slicer.
Step 1. Created an new table called ‘Measurechoice’ like image below.

Step 2. Create a measure called ‘Selected Value’
Selected Value = SWITCH(SELECTEDVALUE(‘Measurechoice'[Index]),1,[Total Revenue],2,[Total Cost],3,[Total Profit],BLANK())
Step 3. Create a slicer using ‘MeasureChoice’ from the new table created.
Step 4. Create a visual use the ‘Selected Value’ as Value
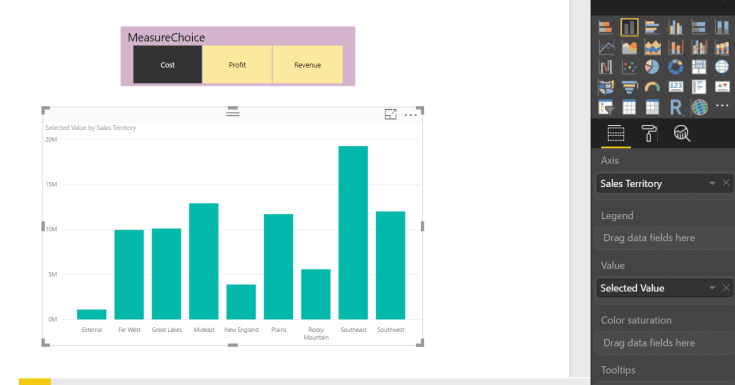
Personally, I like the disconnected table method because I don’t need to spend time on creating images and link bookmarks. However, the bookmarks choice can help dynamically change the title of the visual and give you the ability to change the layout of your bookmark views. Now it is your choice to choose either one to fit your reporting needs.
Thanks for spending time reading this blog.

Happy learning! Nice to see what you have tried
LikeLike
Hi, the third measure in the switch statement should be [Total Profit], not [Total Revenue] to match the selection from the disconnected table.
LikeLike
Thank you for catching this! I have updated it. ^_^
LikeLike